Developers often start LLM selection by choosing a model such as Claude, Llama, Gemini, or DeepSeek, then treat the provider as a secondary decision. That’s understandable. But the model choice alone doesn’t tell you how the model performs through a specific provider endpoint.

The same model can run through multiple provider endpoints, and each endpoint can bring different infrastructure, routing behavior, quantization choices, and failure patterns. Your users and systems see those differences in practical ways. One provider may return the first token quickly, but slow down during the rest of the response. Another may serve a lower-precision variant that drifts on harder prompts. Another may perform well under normal traffic but fail under load.
Provider evaluation compares serving environments rather than treating the model as a standalone product. It asks how long users wait for the first token, how quickly the rest of the response arrives, how the provider behaves under load, and what precision level the model runs at.
This guide works through those questions in the order in which you can act on them: latency, throughput, uptime, and quantization. Once you can measure those trade-offs, the next step is to turn the results into routing logic so your application doesn’t hard-code whichever provider looked fastest in a single benchmark run.
A chat product, a document-generation pipeline, and a background summarization job don’t need the same performance profile. The right provider depends on the workload.
A provider can look fast at the start of a response and still feel slow by the time the full answer finishes. Time to first token (TTFT) captures the first part of that experience. Output speed captures the second part because it measures how many tokens the provider generates per second after generation begins. A provider with strong TTFT can still produce a weak long-form experience if its sustained token rate drops, while a provider with strong throughput can still feel poor in a chat interface if the first token arrives late.
Uptime adds the production layer that speed metrics can’t cover. A provider that performs well in benchmark conditions can still hurt the application if it fails during peak usage, rate-limits unexpectedly, or creates error spikes that force retries.
Once those measurements are separated, the next step is to read them at the appropriate confidence level. Median latency can describe the typical request, but production systems also need to know how many requests take much longer than the typical one. That’s where percentile metrics such as p50, p75, p90, and p99 become more useful than averages.
Averages hide the requests that create the worst user experience. If a provider serves most requests quickly but occasionally stalls badly, the average may still look acceptable, but your users will remember the stalled request.
We track latency and throughput metrics:https://openrouter.ai/docs/guides/routing/provider-selection for each model and provider using percentile statistics over a rolling 5-minute window. The available percentiles are p50, p75, p90, and p99.
A p50 latency value describes the median request, but it can hide the requests that sit much farther out in the distribution. A provider can have a strong p50 and a weak p99, meaning the typical request feels fine while a small but meaningful share of requests take long enough to create visible delays.
The right percentile depends on where the delay actually damages the workflow. In a chat interface, delay appears before the first token arrives, so p90 and p99 latency indicate whether the experience remains consistent beyond the typical request. In a batch job, the user isn’t waiting for each response to start, so sustained output speed provides a better view of how much work the system can complete over time.
As a concrete example, on June 24, 2026 UTC, two providers serving anthropic/claude-sonnet-4.5 showed different latency curves over a 1-day window, and both had a much wider p99 tail than their p50 values suggest.
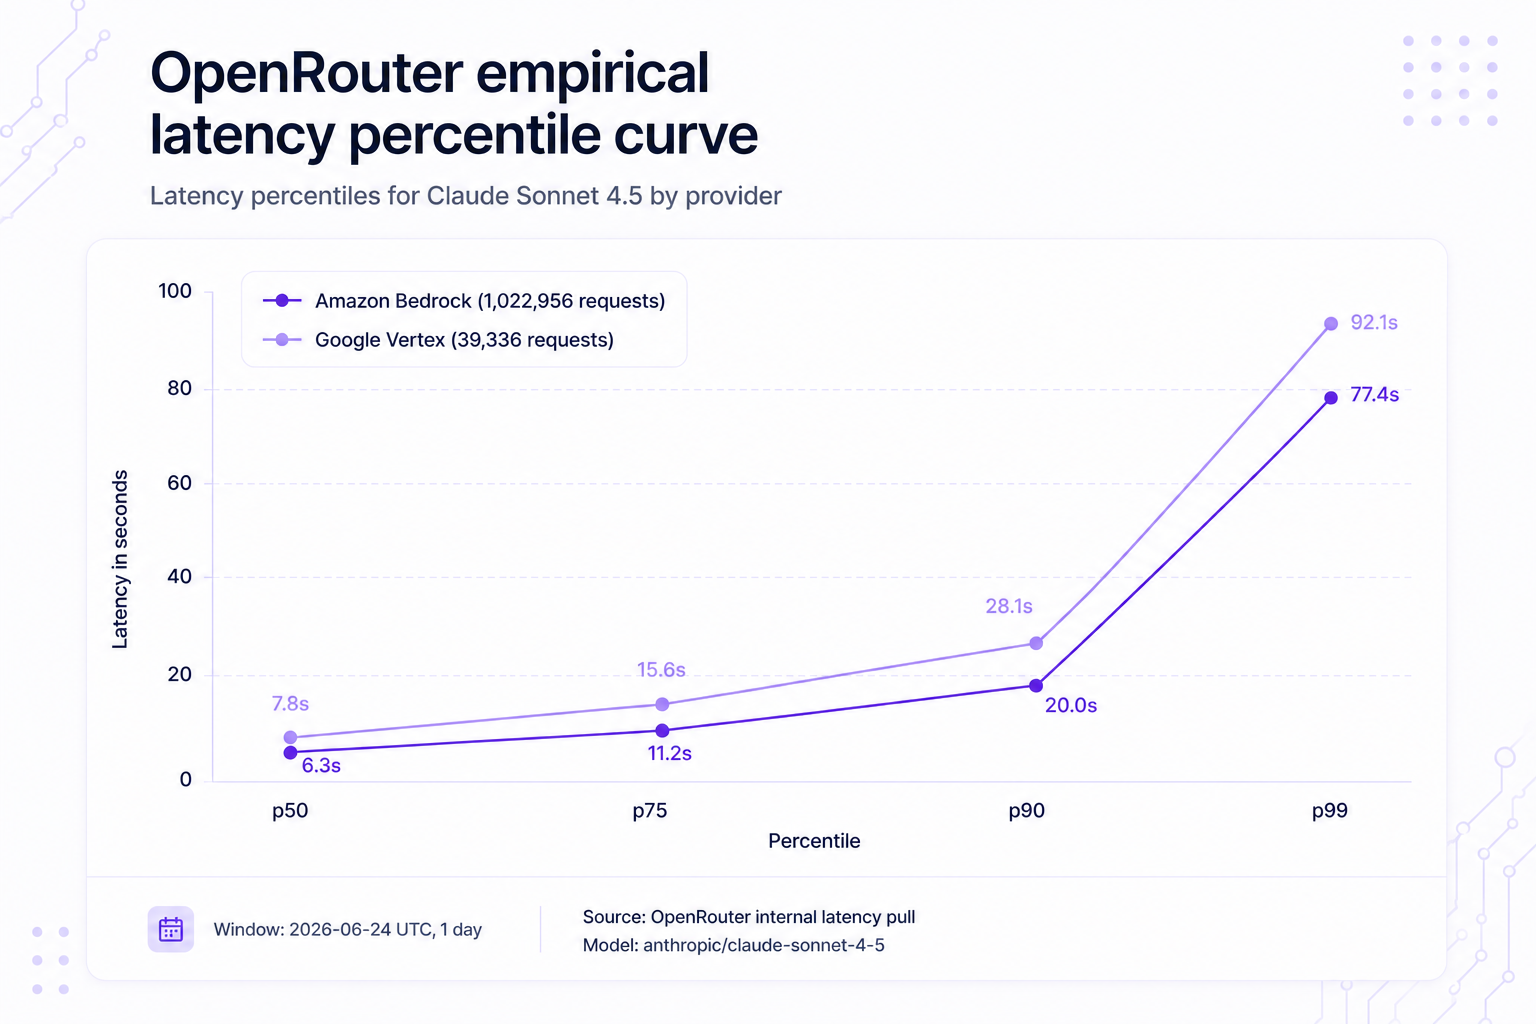
Percentiles show how consistently a provider responds, but they don’t explain every difference between two providers serving the same model. Once latency and throughput are clear, the next question is whether both providers are serving the model in the same form.
Quantization is one of the easiest provider differences to miss because the model name doesn’t always reveal how the model is being served. Two providers can expose the same model slug while running it at different precision levels. One route may preserve more of the model’s original weight precision, while another may reduce precision to lower memory use, improve serving efficiency, or make the endpoint cheaper to operate.
Reducing precision changes how the model behaves under different types of prompts. Lower precision can make a model faster and cheaper to serve, but it can also change how the model handles prompts that require careful reasoning, code correctness, long context, or strict instruction-following.
We expose quantization as a routing decision because provider selection shouldn’t treat every endpoint with the same model name as equivalent. The quantizations:https://openrouter.ai/docs/guides/routing/provider-selection field lets you choose which precision levels your application can use, so quality risk becomes part of the routing policy instead of a hidden provider detail.
Read the table as a way to decide how much precision your workload can afford to trade for lower serving cost or higher speed. A summarization pipeline may tolerate a lower-precision endpoint if the outputs stay stable on your own test set. A code-editing workflow, tool-calling agent, or reasoning-heavy task gives you less room for silent quality loss because a small drift can change the answer, break a call, or produce code that looks plausible but fails.
When your evaluation shows that a workload needs higher precision, use the quantizations field to limit the provider endpoints your application can use:
You can also exclude a provider if your evaluation shows that its endpoint performs poorly for your prompts:
The model name starts the evaluation, but the provider endpoint completes it. Quantization is one reason public benchmarks and production behavior can diverge.
A public leaderboard:https://openrouter.ai/rankings helps you narrow the candidate set, but it can’t describe your production path. Benchmarks measure selected endpoints at a point in time, using their own prompts, parameters, regions, and scoring methods. Your application may use a different endpoint, prompt shape, or routing path than the one the benchmark measured.
A useful provider benchmark review should check the benchmark’s published methodology before treating the result as production evidence:
A benchmark result becomes useful when it leads to a second round of testing under your own workload. If a leaderboard points to a fast provider, the next question is whether that endpoint stays fast with your prompt length, routing path, and quality requirements. If it does, convert that result into a routing rule.
Hard-coding a single provider from a static ranking creates a fragile setup. Provider behavior varies with traffic, outages, routing paths, and serving configurations. That’s what our routing layer is designed to handle.
Evaluating one provider in isolation only tells you how that provider behaved under the conditions you measured. It doesn’t tell you what happens when the provider hits a rate limit, slows down under load, or becomes temporarily unavailable. If your application depends on one provider endpoint, every provider-side failure becomes part of your application’s behavior.
A routing layer changes the evaluation from a one-time provider choice into an ongoing selection problem. Instead of treating every provider outage, rate limit, or slowdown as an application failure, you can automatically route around those conditions.
We monitor response times, error rates, and availability:https://openrouter.ai/docs/guides/best-practices/uptime-optimization across providers in real time. Our default routing deprioritizes providers that saw significant outages in the last 30 seconds, load-balances across the stable ones weighted toward lower prices, and keeps the rest available as fallbacks.
Multi-provider routing doesn’t guarantee perfect uptime. It reduces dependence on a single endpoint by providing an alternative path when a provider fails or becomes unavailable.
Model fallbacks:https://openrouter.ai/docs/guides/routing/model-fallbacks apply the same principle when provider-level routing is insufficient. If the primary model can’t complete the request because its providers are down, rate-limited, or unable to answer, OpenRouter can try the next model in the fallback list.
A practical routing strategy should answer three questions:
The main routing controls:https://openrouter.ai/docs/guides/routing/provider-selection sit inside the provider object. They let you sort providers, prefer performance thresholds, choose or avoid provider endpoints, filter by quantization, and decide whether fallbacks can run. Model fallbacks use the models array.
The simplest controls are the model suffixes:https://openrouter.ai/docs/guides/routing/provider-selection. Add :nitro when the request should prioritize providers with higher throughput:
Add :floor when the request should prioritize lower price:
Those shortcuts work when one preference should dominate the request. Production routing often needs a narrower rule. For example, a support workflow may need the cheapest endpoint that still sustains enough throughput for longer summaries. In that case, combine price sorting with a throughput preference:
This request asks OpenRouter to look across the listed models and prefer the cheapest model and provider endpoint that reaches 50 tokens per second at p90. Endpoints below that threshold don’t disappear from the route. They move behind preferred options, which keep them available if all preferred endpoints fail.
A chat workflow can use the same pattern with latency. If the first-token delay creates the user-visible bottleneck, combine price sorting with a latency preference:
This request keeps price in the decision, but it prefers endpoints that keep p90 latency under 3 seconds. The preference comes from the provider evaluation rather than from a fixed provider choice.
The same pattern works for quality and reliability decisions. If a workload performs better on higher-precision endpoints, add a quantization filter:
If a provider failed your test set or doesn’t meet your operational requirements, exclude it from the route:
If completion reliability matters more than staying with a single model, use a fallback list:https://openrouter.ai/docs/guides/routing/model-fallbacks:
The routing policy should come after measurement, not before it. Before you set thresholds, you need a simple evaluation process that tells you which thresholds matter.
Define the workload first. Don’t start with the provider. Start with the product behavior you need. A streaming chat app should measure time to first token and p90 latency. A batch-generation workflow should measure throughput and total completion time. A reasoning-heavy workflow should add quality checks and quantization review.
Shortlist with external benchmarks and live provider data. Use public leaderboards:https://openrouter.ai/rankings to identify candidates, then check current provider data on the model’s page:https://openrouter.ai/models in our catalog.
Test with your own prompts. Run prompts that represent your product’s real workload. Include short prompts, long prompts, easy prompts, and the prompts that usually break weak providers. Measure speed, reliability, and output quality together.
Check quantization and provider behavior. If two providers serve the same model but one gives worse answers on hard prompts, check the serving path before blaming the model. Pin higher precision or exclude the weaker endpoint when your evaluation supports that decision.
Enforce the result through routing. Turn the evaluation into request settings:https://openrouter.ai/docs/guides/routing/provider-selection. Use sort , :nitro , :floor , preferred_min_throughput , preferred_max_latency , quantizations , ignore , and fallbacks to keep the application aligned with the measurements. That keeps provider choice tied to your application rather than to a generic market ranking, and it makes performance review repeatable as provider behavior changes over time.
Latency measures how long the user waits before the first token arrives. Throughput measures the number of output tokens the provider generates per second after generation starts. A chat UI usually prioritizes latency, while a long-output workflow prioritizes throughput.
p50 is the median request experience. p90 means 90% of requests complete at or below that latency value. p99 shows the far tail of the distribution, which you need when your application must respond predictably for nearly all users.
The provider endpoint can change the serving environment. Quantization, infrastructure, context support, load, and provider defaults can all affect output behavior. The model slug identifies the model family, but the provider path affects the production result.
After you confirm the problem varies by provider, test it against your own prompts first. If the problem is repeatable, use provider.ignore to exclude that provider. If the issue appears tied to lower precision, use provider.quantizations to prefer higher-precision endpoints.
Multi-provider routing can improve reliability by adding fallback paths when a provider fails, rate-limits, or goes down. It reduces single-provider dependency, but it still depends on the quality of the routing policy and the available providers.
No. The request is priced using the model and provider endpoint that ultimately serve the completion. OpenRouter doesn’t mark up provider pricing, and failed requests aren’t billed, whether you route to one provider or ten.
Use provider.sort: "latency" when you care about time to first token. Use provider.sort: "throughput" or the :nitro suffix when you care about long-form generation speed. Add percentile thresholds when you need predictable performance rather than a simple speed preference.

 Scan to open this article