You can now automatically classify your OpenRouter generations with structured metadata for AI usage reporting.

Every request carries information: the type of work, the level of complexity, which department it came from, whether it contains internal data it shouldn’t. Classifiers, now available in beta, give you that visibility. Define your criteria (task type, agent complexity, compliance category, cost center). A model of your choice tags each generation, or a sampled subset, against your taxonomy and write the results to your logs. You get continuous visibility into what your agents and users are doing, which models they’re using for different tasks, and where the costs go.
Create a classifier:https://openrouter.ai/workspaces/default/classifiers in your workspace settings, or read the docs:https://openrouter.ai/docs/guides/features/classifiers first.
A classifier is a small config with four parts: a taxonomy (up to eight dimensions, each with the values you choose), a classification prompt (instructions sent to the classifier model as a system message), a model to read each prompt and apply it, and a sampling rate . Classification runs asynchronously after each request completes, so it never adds latency to your inference path.
Choose from six preset templates, customize a template, or build your own from scratch.
Select your classification model. We recommend Gemini 3.5 Flash Lite:https://openrouter.ai/google/gemini-3.5-flash-lite for the best value: cheap, strong accuracy on structured output, good enough for most taxonomies. You can change the model at any time.
At high throughput, the cost of classifying every request adds up. Use the sampling rate to keep costs down. Run a high-fidelity compliance classifier at 100% while a broader cost-attribution classifier samples 10% of the same traffic, keeping costs proportional to the oversight you need.
Classifier outputs are coerced into structured formats, constrained to the dimensions and values you define. Every classified generation is tagged in your logs:https://openrouter.ai/logs, so you can filter requests by classification. For example, you can pull every request tagged department: legal or agent_complexity_difficulty_tier: complex_multistep . Each tagged generation’s detail panel breaks down classified dimensions and values.
You can also run a classifier on demand against any past generation to sanity-check a new taxonomy. Open it in your logs, pick a classifier, and see how it gets tagged.
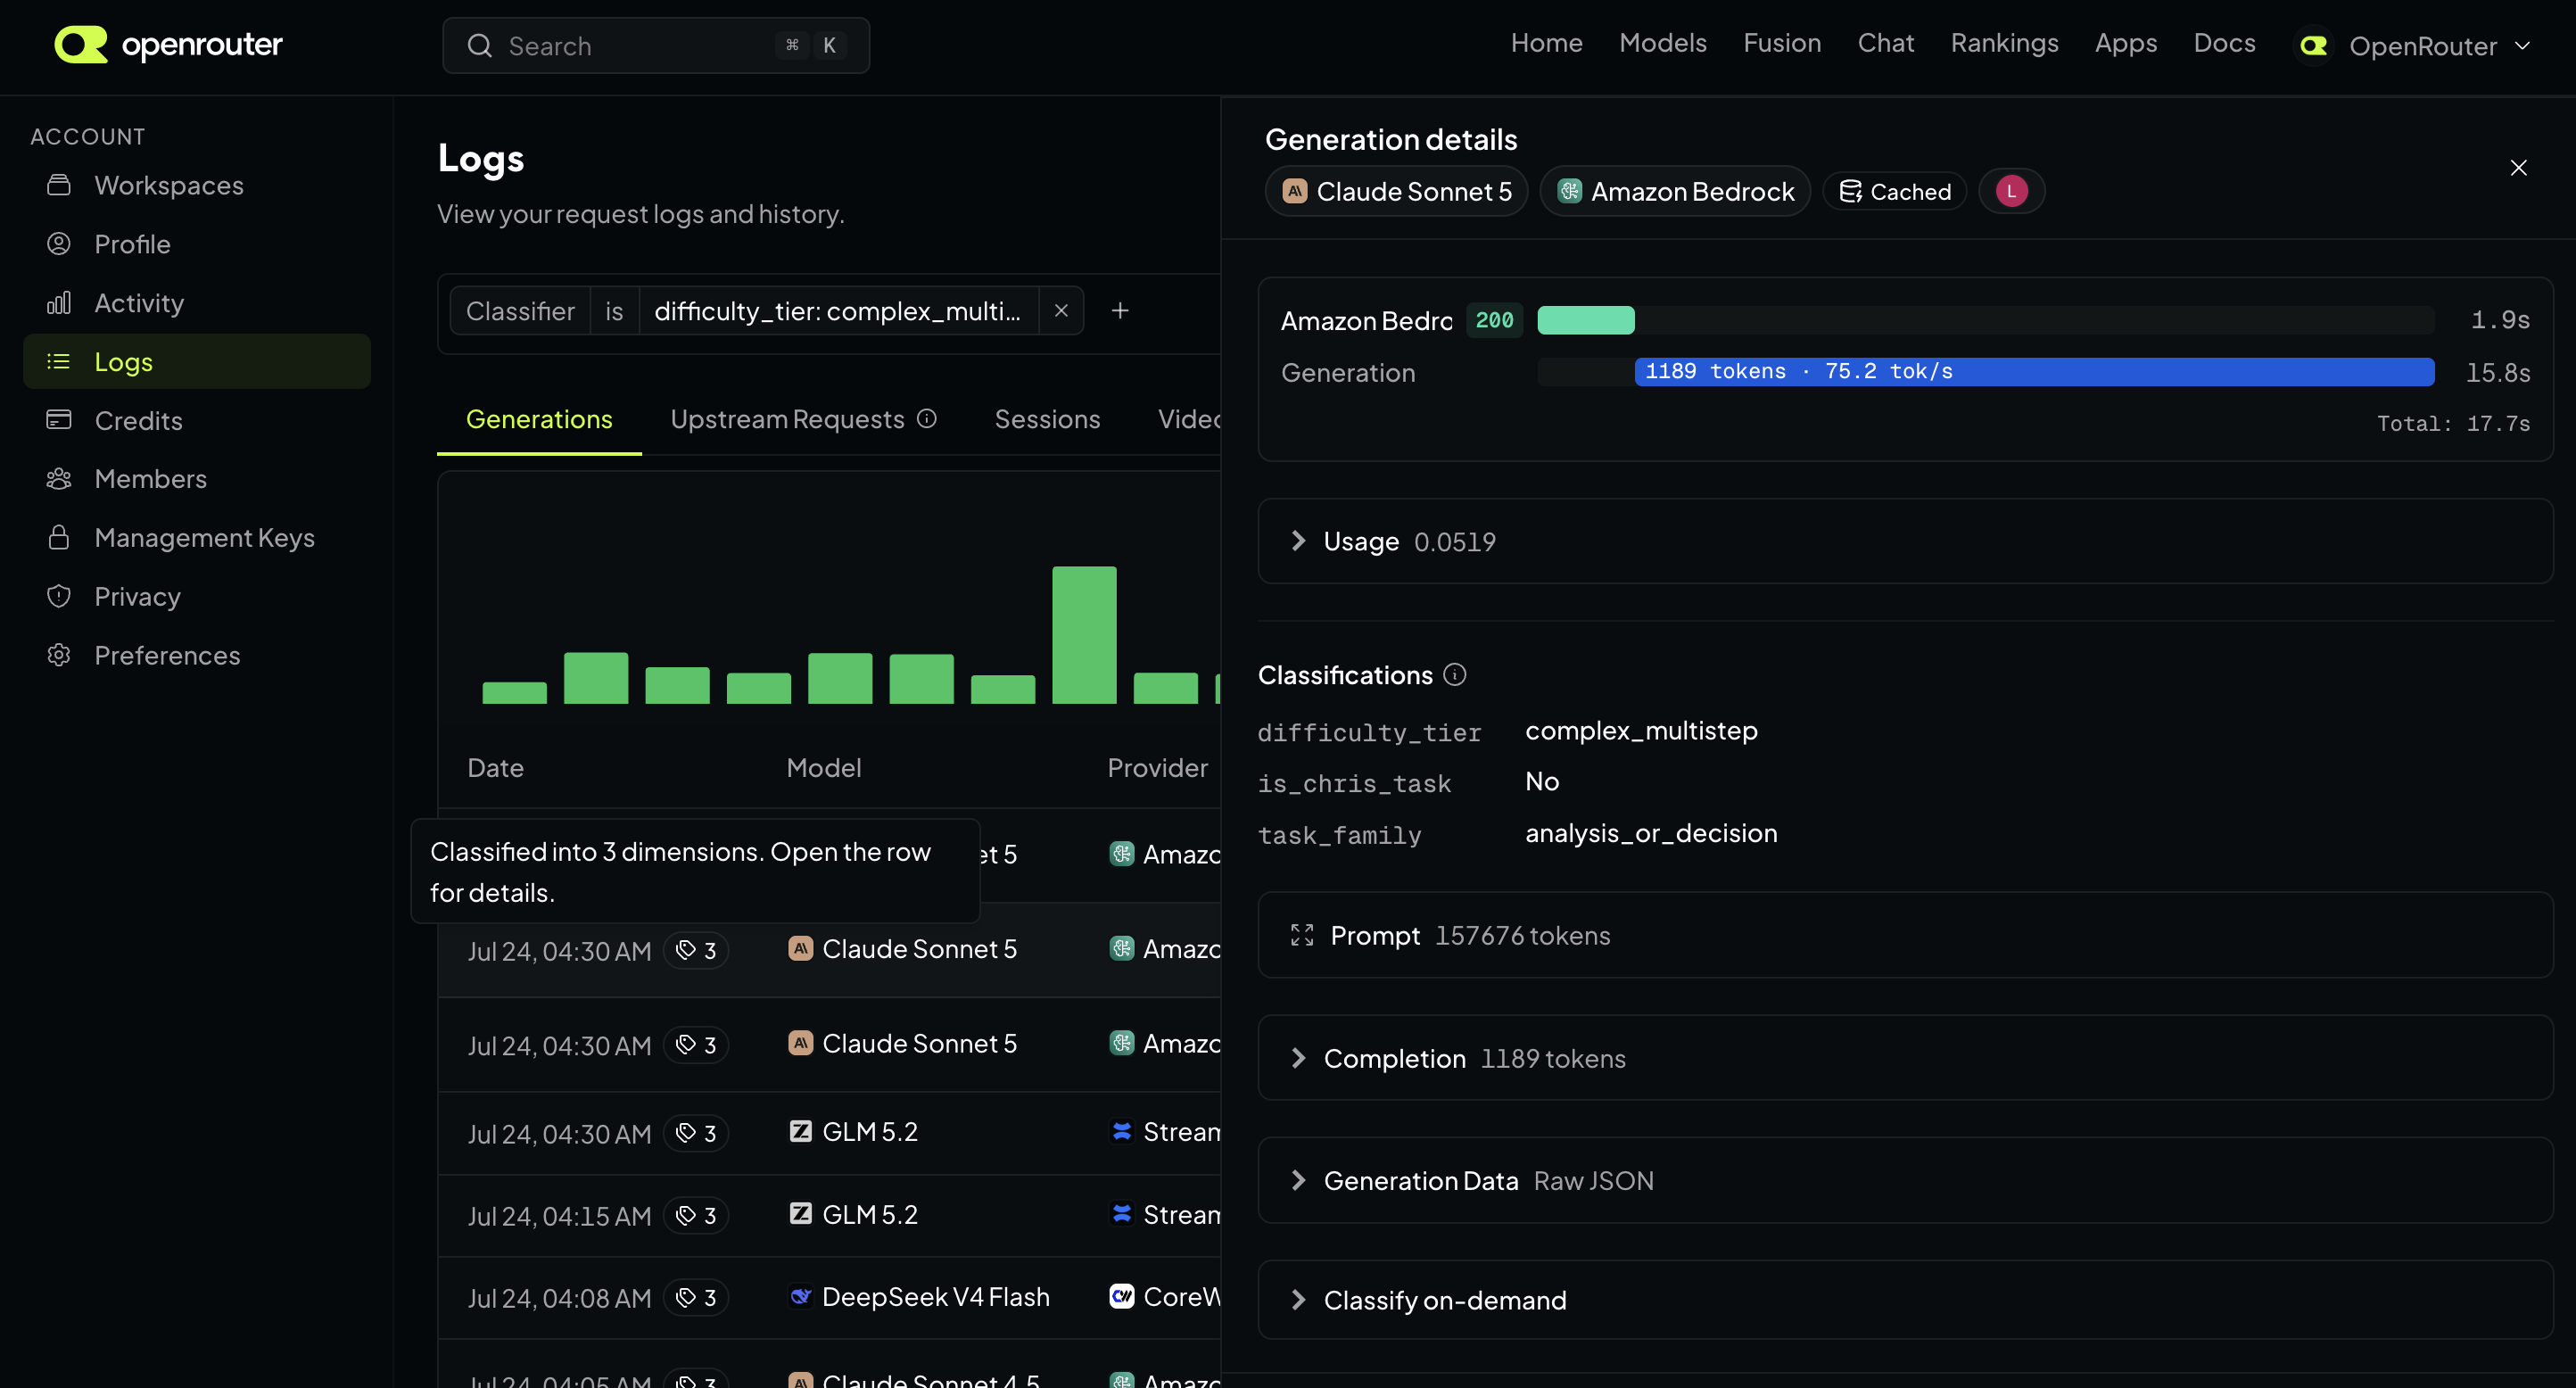
Individual tags on generations answer “what was this request?” The Activity Explorer:https://openrouter.ai/activity/explore answers the aggregate questions: group your traffic by any classifier dimension to see which models are being used for each task type or level of agent complexity, and which departments or tasks drive the most spend.
Results are aggregated over time; watch patterns shift in your data and show stakeholders how your AI usage is governed. Classifier filters carry across the Activity tabs so you can see trends:https://openrouter.ai/activity/trends and guardrail:https://openrouter.ai/activity/guardrails enforcement by any classifier value.
Classifiers are available now in beta. Create a classifier:https://openrouter.ai/workspaces/default/classifiers in your workspace or read the docs:https://openrouter.ai/docs/guides/features/classifiers to learn more about taxonomy design, billing, and how classification works under the hood. Classifiers work even with input & output logging disabled.
Tell us what you think in #feedback:https://discord.gg/fVyRaUDgxW on Discord.
 Scan to open this article