Batch-1 decode keeps getting more important. Xiaomi MiMo, for example, announced MiMo-V2.5-Pro UltraSpeed in June:https://mimo.xiaomi.com/blog/mimo-tilert-1000tps, claiming 1,000 tok/s decode on a one-trillion-parameter MoE model.
Batch 1 gives an inference stack no room to hide overhead. There is no batch to amortize launch cost across, no concurrency to fill pipeline bubbles, and not enough arithmetic intensity for clever tiling to pay off. Every microsecond on the critical path is a microsecond the user waits.
This post is about pushing that floor down for Ling-3.0-flash, a hybrid linear-attention MoE model, on 4 NVIDIA Blackwell GPUs. It covers two speculative decoding paths. On the NEXTN/MTP path we moved single-request decode from 288 tok/s to 606 tok/s and mean TPOT from 3.33 ms to 1.53 ms. The second path is DSpark, a confidence-scheduled speculative decoder built on the same stack: a 1000-request run reaches 1120 tok/s at a mean TPOT of 0.78 ms and an accept length of 9.95. That last comparison is the controlled one: NEXTN and DSpark were measured with the same command on the same machine, and mean TPOT is 1.9x lower (1.53 ms to 0.78 ms). The rest of the post is where that time was going and what it took to get it back.
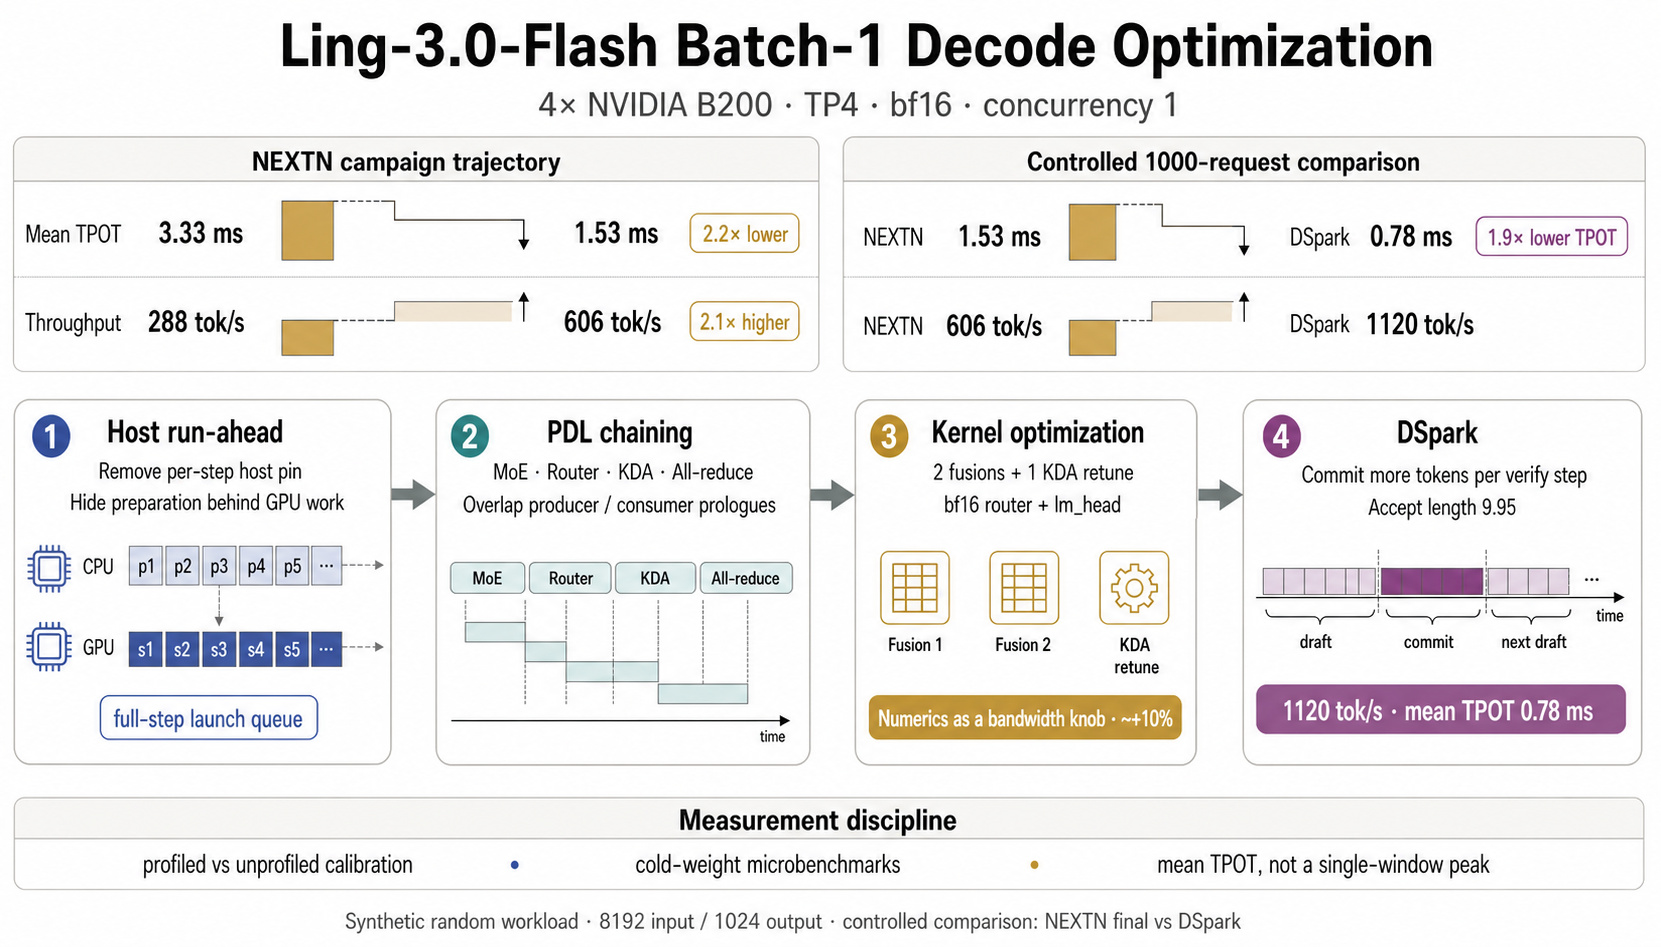
Figure 1. Headline results across the four configurations.
On GSM8K, the same stack scored: accuracy 0.889, invalid 0.000, latency 341.5 s, output throughput 511.1 tok/s.
All runs use Ling-3.0-flash on 4 Blackwell GPUs, TP4, bf16, concurrency 1, greedy decoding, and the same fixed 8192-input / 1024-output random workload. From left to right, the columns show the initial NEXTN baseline, NEXTN after the draft-extend graph fix, final tuned NEXTN, and DSpark. The first two are shorter campaign checkpoints; the last two are the controlled comparison, each measured over the same 1000 requests on the same machine. Peak throughput is compared only between the last two runs because it is the maximum over fixed one-second windows.
Two definitions matter here, because together they explain why output throughput is not simply the reciprocal of mean TPOT even at concurrency 1: SGLang's TPOT excludes TTFT, while output throughput divides total output tokens by total benchmark wall time (see the bench_serving guide:https://github.com/sgl-project/sglang/blob/main/docs/developer_guide/bench_serving.md). All headline benchmark runs in this post use a synthetic random workload; accept length in particular depends on the prompt and output distribution, so 9.95 is this workload's accept length rather than the model's.
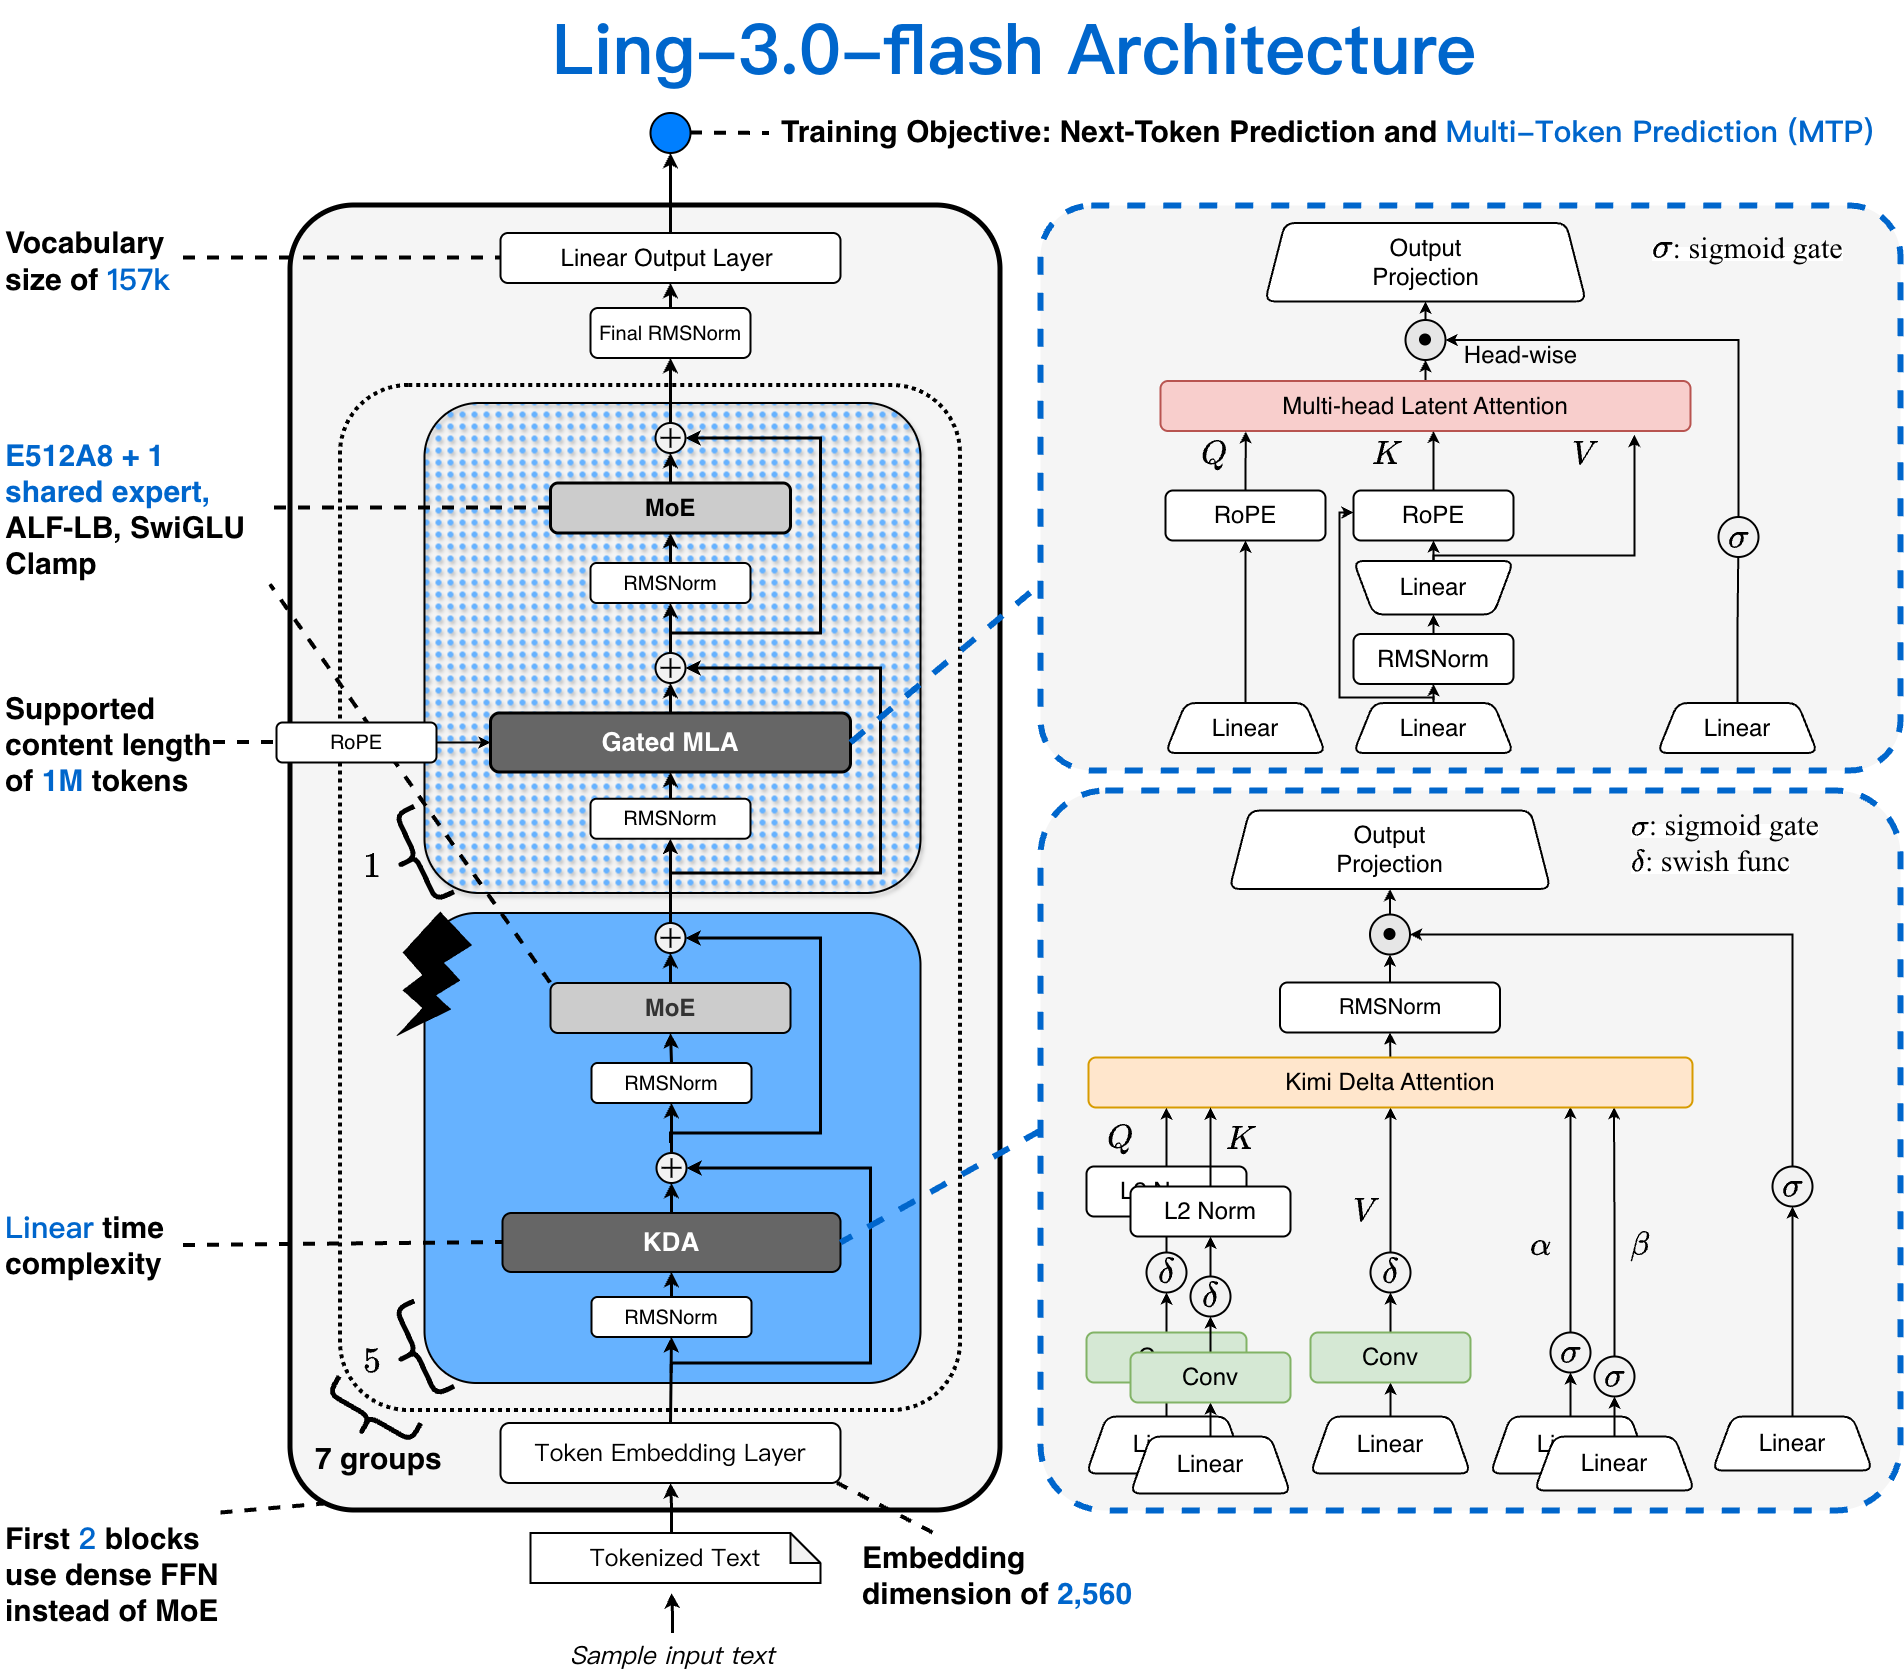
Figure 2. Ling-3.0-Flash architecture: 42 layers interleaving 35 KDA linear-attention layers with 7 MLA full-attention layers over a 512-expert MoE.
Ling-3.0-flash is a hybrid-attention MoE model ( BailingMoeV3 ), and most of what follows comes from that word hybrid .
Five of every six attention layers are KDA. That is why MLA attention costs only 244 µs per step at 8k context in the final profile, and why this model is a good batch-1 target in the first place: with attention cheap and the batch tiny, what remains on the critical path is weight bandwidth and launch latency, which is exactly the regime this post is about.
We decode with NEXTN speculative decoding at steps=5, topk=1, draft_tokens=6 . One decode step is three CUDA graphs in a relay.
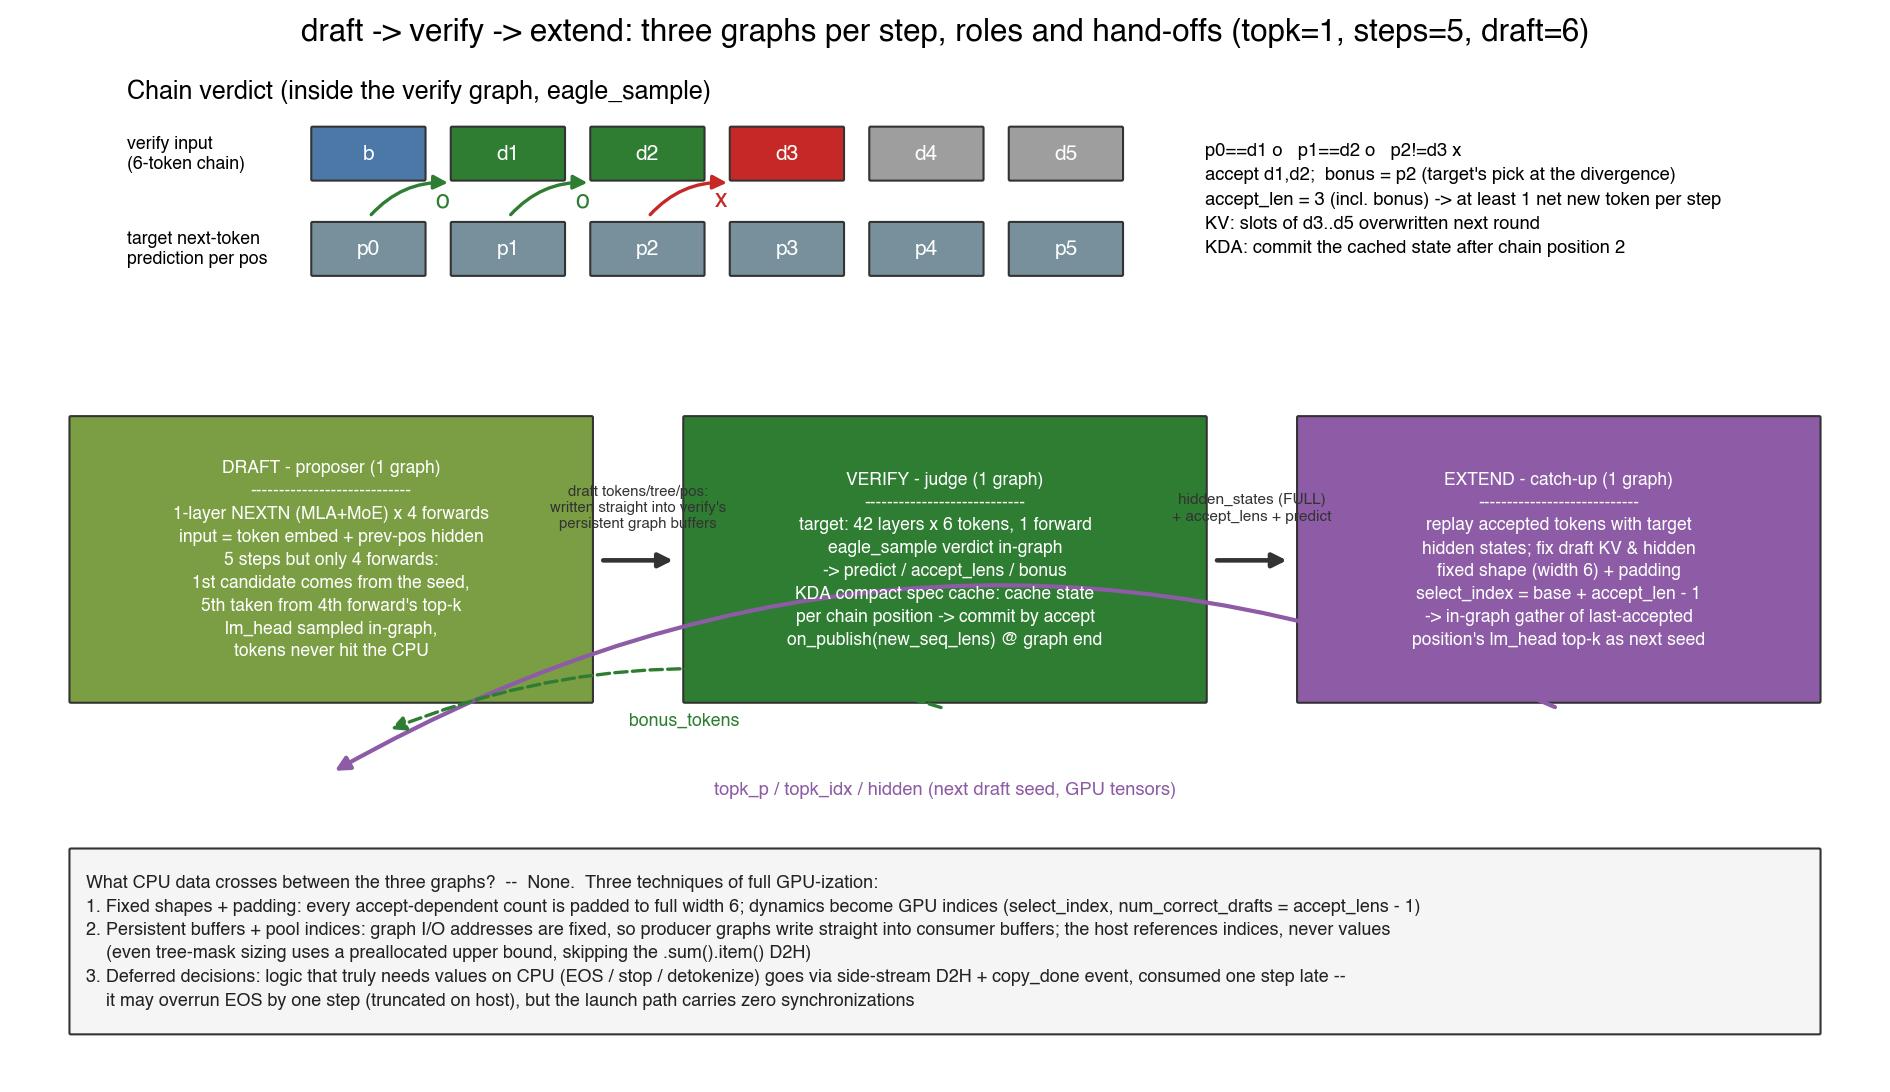
Figure 3. Three graphs per step. The draft model proposes a 6-token chain, the target model scores all six in a single forward, and the extend graph replays the accepted prefix with the target's real hidden states to produce the next round's seed. The verdict itself ( eagle_sample ) happens inside the verify graph; the host learns how many tokens were accepted one step late.
The draft is a single-layer NEXTN model run autoregressively: five steps but only four forwards, because the first candidate comes from the previous round's seed and the fifth is read off the fourth forward's top-k. Verify is one forward of the full 42-layer target over all six chain positions. Extend fixes up the draft's KV cache, which only ever saw the draft's own guesses, and hands back the seed for the next round.
What crosses between the three graphs on the CPU is nothing. Fixed shapes plus padding make every accept-dependent count a GPU index rather than a host value; persistent buffers let producer graphs write straight into consumer buffers; and the decisions that genuinely need values on the CPU (EOS, stop strings, detokenization) go through a side-stream D2H and a copy_done event consumed one step late. Everything below rests on that property.
When we started, the GPU was busy about two-thirds of the step. Idle time at batch 1 comes in two flavors, and they need separate diagnoses because the fixes have nothing in common:
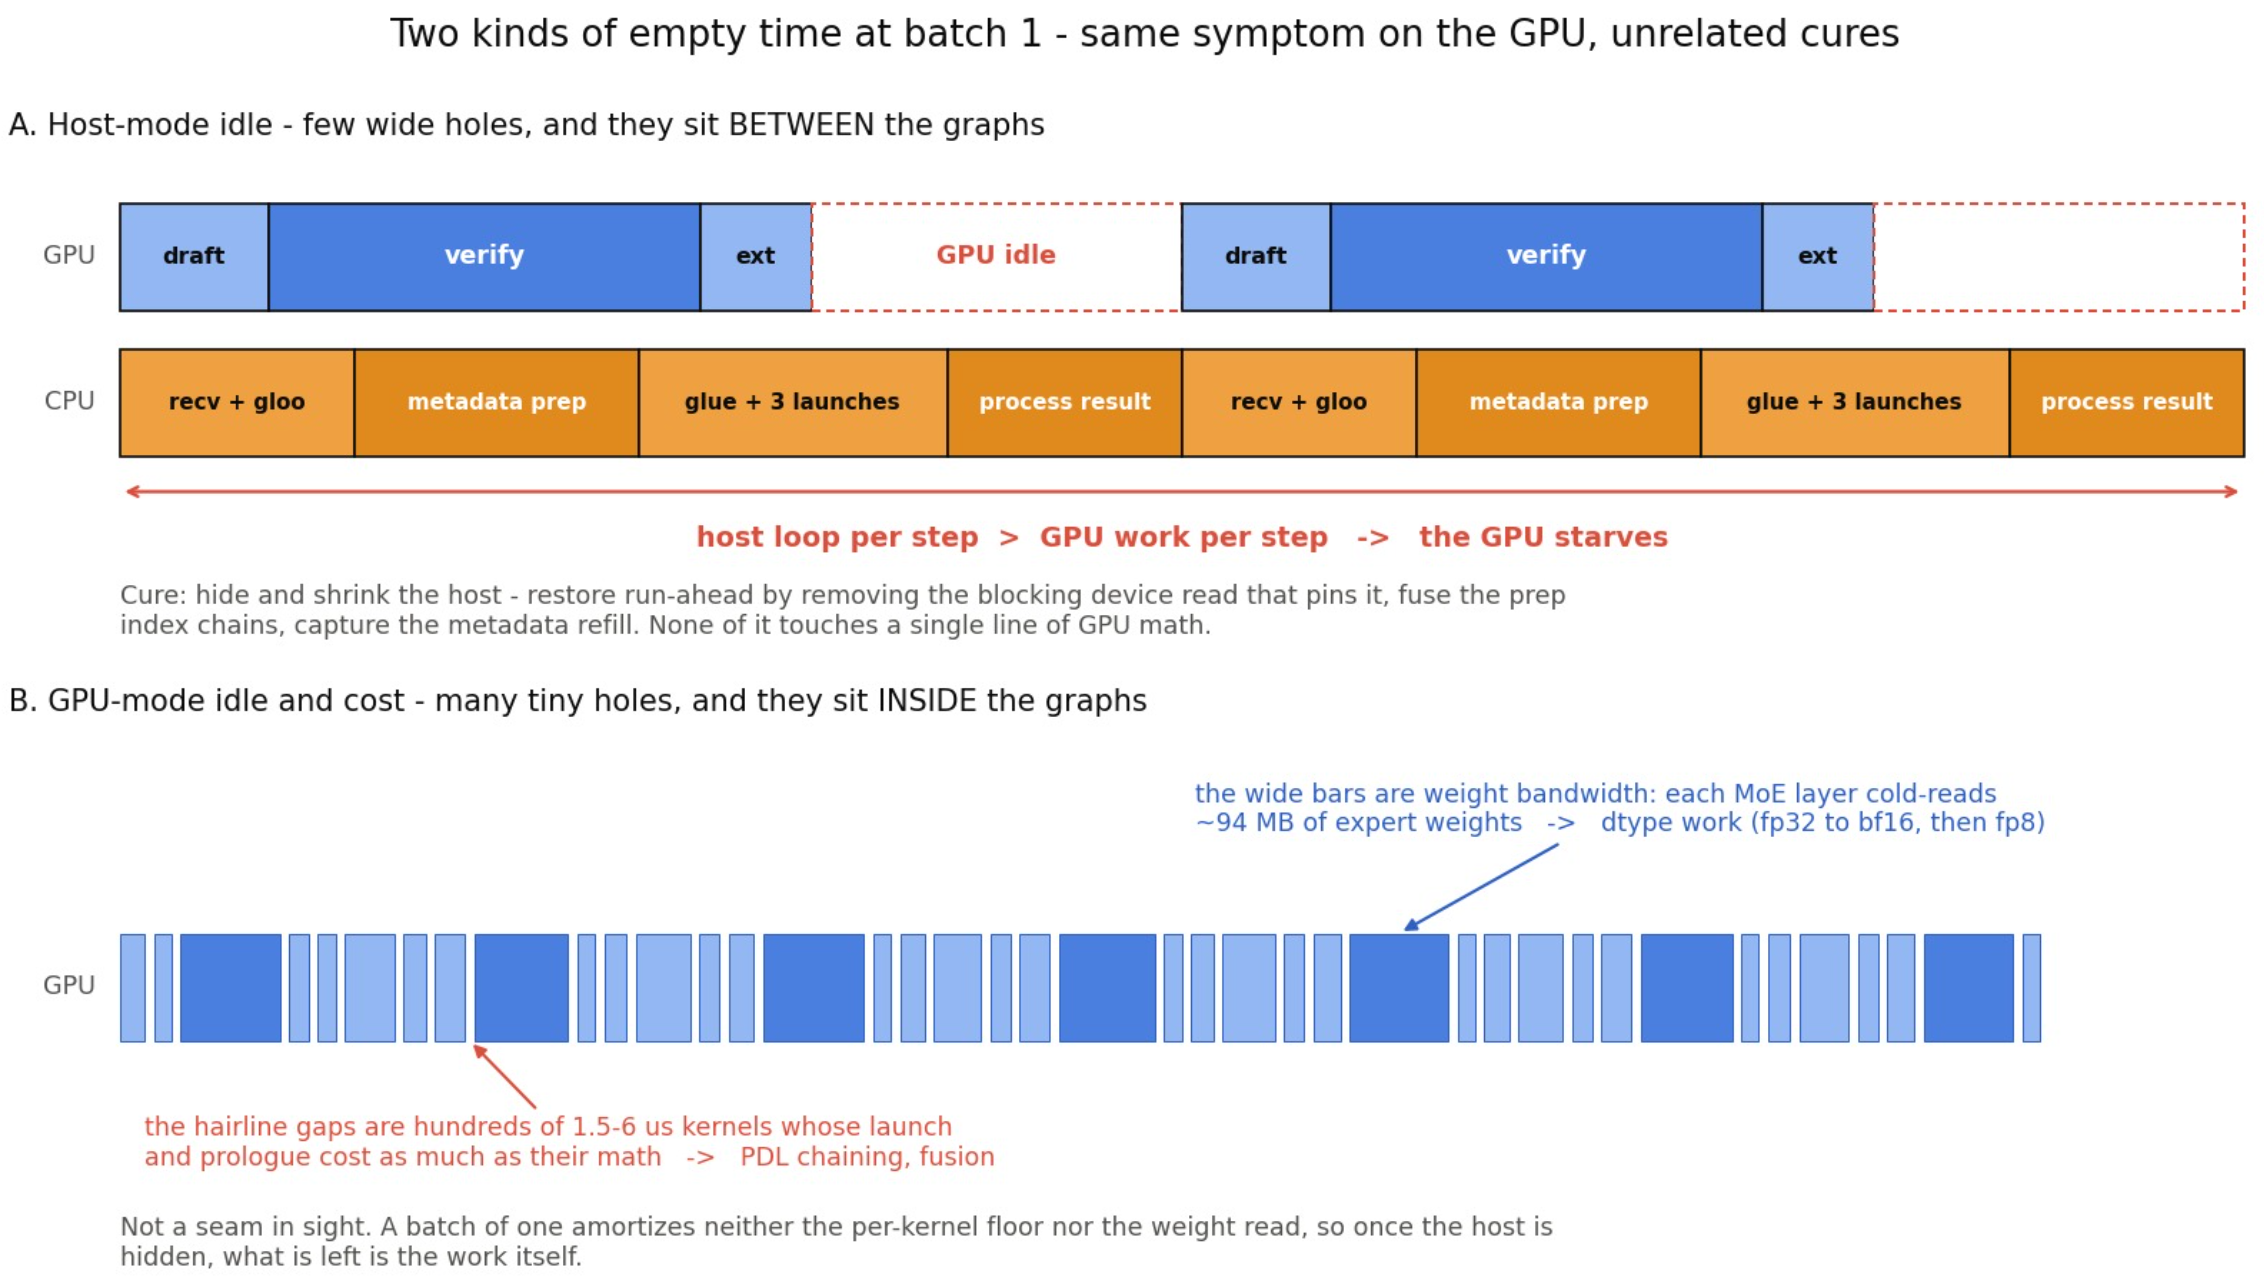
Figure 4. Two shapes of idle. Top: the host loop is longer than the GPU's work, so the holes are few and wide and land in the seams between graphs. Bottom: once the host is hidden, what remains is several hundred 1.5-6 µs kernel nodes whose launch floor rivals their arithmetic, plus the weight read itself.
These two kinds of idle describe the step-time side of TPOT. The other lever is how many tokens each step commits: mean TPOT ≈ step time / mean accept length. The rest of the post follows those levers. Host run-ahead and seam work remove host-mode idle; PDL, dtype changes, fusion, and retuning shorten the GPU critical path; speculation tuning and DSpark increase the tokens committed per target step. DSpark later revisits the first category when a blocking D2H read reintroduces a host pin.
Three properties of the measurement setup shape every number below.
The profiler inflates host-side events. CUPTI adds overhead to each host event it records. On the same configuration, a profiled step measures 5.2 ms while the real step, back-computed from TPOT × accept length on an unprofiled run, is 4.9 ms. That 0.3 ms gap is the same order as the host-side effects we wanted to reason about, so a profiled trace can show cross-rank waits that do not exist off the profiler. GPU kernel durations come from hardware timestamps and are more trustworthy than host-side timings, but not immune: tracing still perturbs launch timing, concurrency, cache state, and CUDA graph execution, and Nsight Systems documents potentially significant overhead for CUDA and graph-node tracing (user guide:https://docs.nvidia.com/nsight-systems/UserGuide/index.html). So every host-side conclusion here got a profiled-vs-unprofiled calibration first.
Microbenchmarks run optimistic for cold-weight kernels. A loop calling one kernel repeatedly keeps its 2.6 MB gate weight resident in L2, while the real model flushes L2 with about 94 MB of expert traffic between consecutive calls to the same layer. Hot 7 µs, cold 11 µs: enough to reverse a ranking against the library GEMV.
Peak throughput is a single-window statistic. The benchmark's peak number is the maximum over a fixed 1-second grid, so it carries roughly a ±5% phase band: shifted TTFT/TPOT re-slices the grid, and a change that improves mean throughput by 2.3% can print as a drop from 909 to 858. Both readings reproduce exactly under a fixed seed, so reproducibility does not separate signal from phase. A/B decisions here are made on mean TPOT × mean accept length. That product is a derived estimate of step time rather than a measured one (the product of two aggregates is not the aggregate of the product), but it is stable across runs and insensitive to accept-length drift in these runs, which is what an A/B criterion needs. We report peak but never optimized against it.
Correctness had its own gate, applied to every change before it stayed: byte-exact comparison of a 256-token greedy generation, accept length unchanged within 0.05, and a greedy re-run after interleaving temperature-sampled requests to catch state pollution. Changes that legitimately alter rounding (the bf16 gate, the single-rounding combine) said so in their commit message and were validated on accept and task metrics instead of bit parity.
This is the structural change the rest of the campaign rests on, and it is a host-mode idle fix.
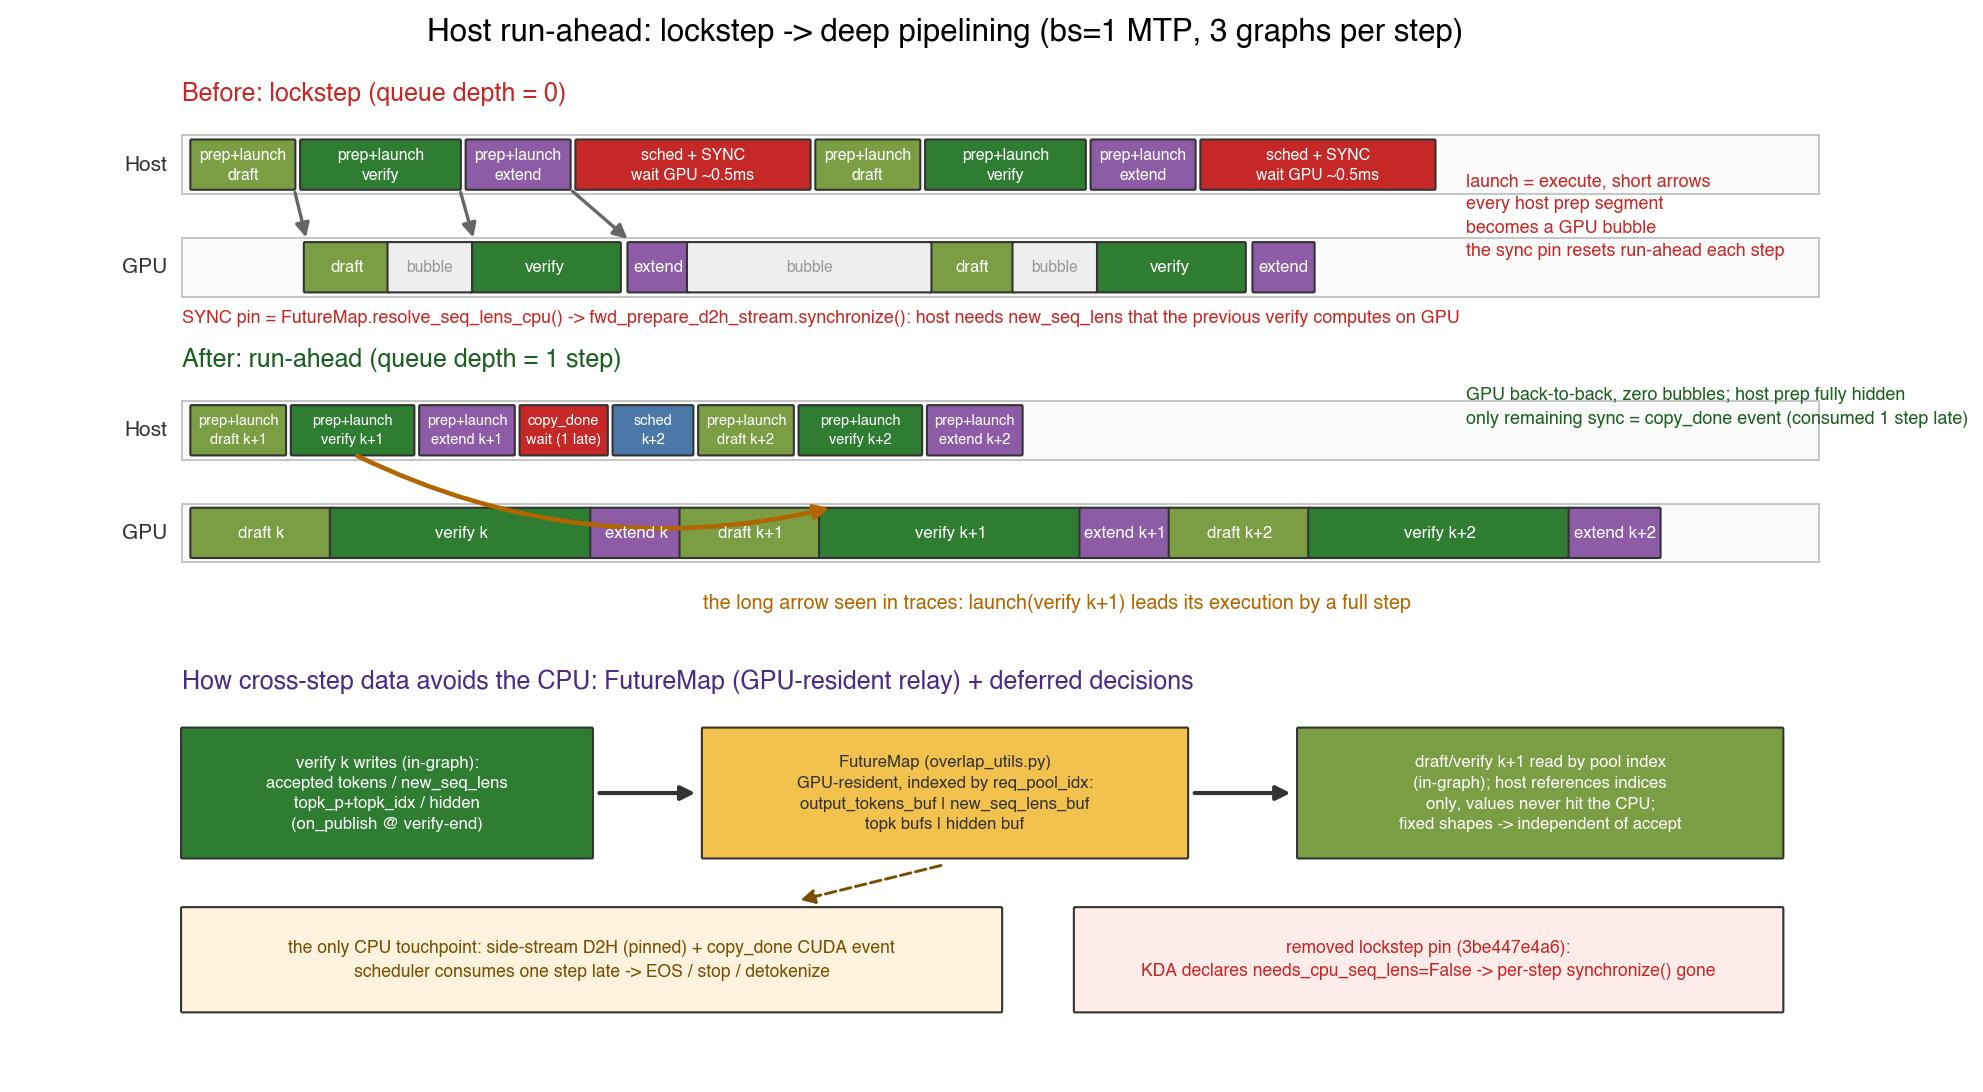
Figure 5. Lockstep to deep pipelining. Before: every step the host blocks in resolve_seq_lens_cpu waiting for the previous verify graph to finish on the GPU, so run-ahead resets to zero and each host prep segment becomes a GPU bubble. After: the queue is a full step deep, the launch of verify k+1 leads its own execution by an entire step, and the only remaining synchronization is a copy_done event consumed one step late.
cudaGraphLaunch has always been asynchronous, and the draft → verify → extend ordering on the GPU is free: same stream, FIFO. So the question was never whether verify waits for draft. It was whether the host is pinned to GPU progress every step.
It was. Under spec-v2, the scheduler does not know the accept length, so FutureMap.resolve_seq_lens_cpu() pulls new_seq_lens back from the GPU while building the next batch: gated on a publish event, copied on a private stream, then synchronize() d. The host was not waiting for a microsecond-scale copy. It was waiting for the previous verify graph to finish executing. Median cost: 485 µs per step, with the run-ahead depth reset to zero every single step.
The cause is the needs_cpu_seq_lens flag, OR-ed across every backend involved in spec-v2. trtllm_mla declares False in all three roles; the sibling linear-attention backends GDNAttnBackend and Mamba2AttnBackend both declare False explicitly. KDAAttnBackend never declared it and inherited the base-class default of True , even though it runs the same base-class metadata code as its two siblings.
Declaring needs_cpu_seq_lens = False collapsed the OR and removed the per-step synchronize. The correctness argument is pointwise: KDA's metadata never reads the CPU mirror, and replay padding comes from forward_batch.num_padding .
How does the host dare launch step k+1 without knowing what step k accepted? Because the values never touch the CPU. FutureMap is a GPU-resident relay: step k's graph writes output tokens, new_seq_lens , top-k probabilities, and hidden states into device buffers indexed by req_pool_idx , and step k+1's graph reads them by the same index. The host only handles indices, which it already knows.
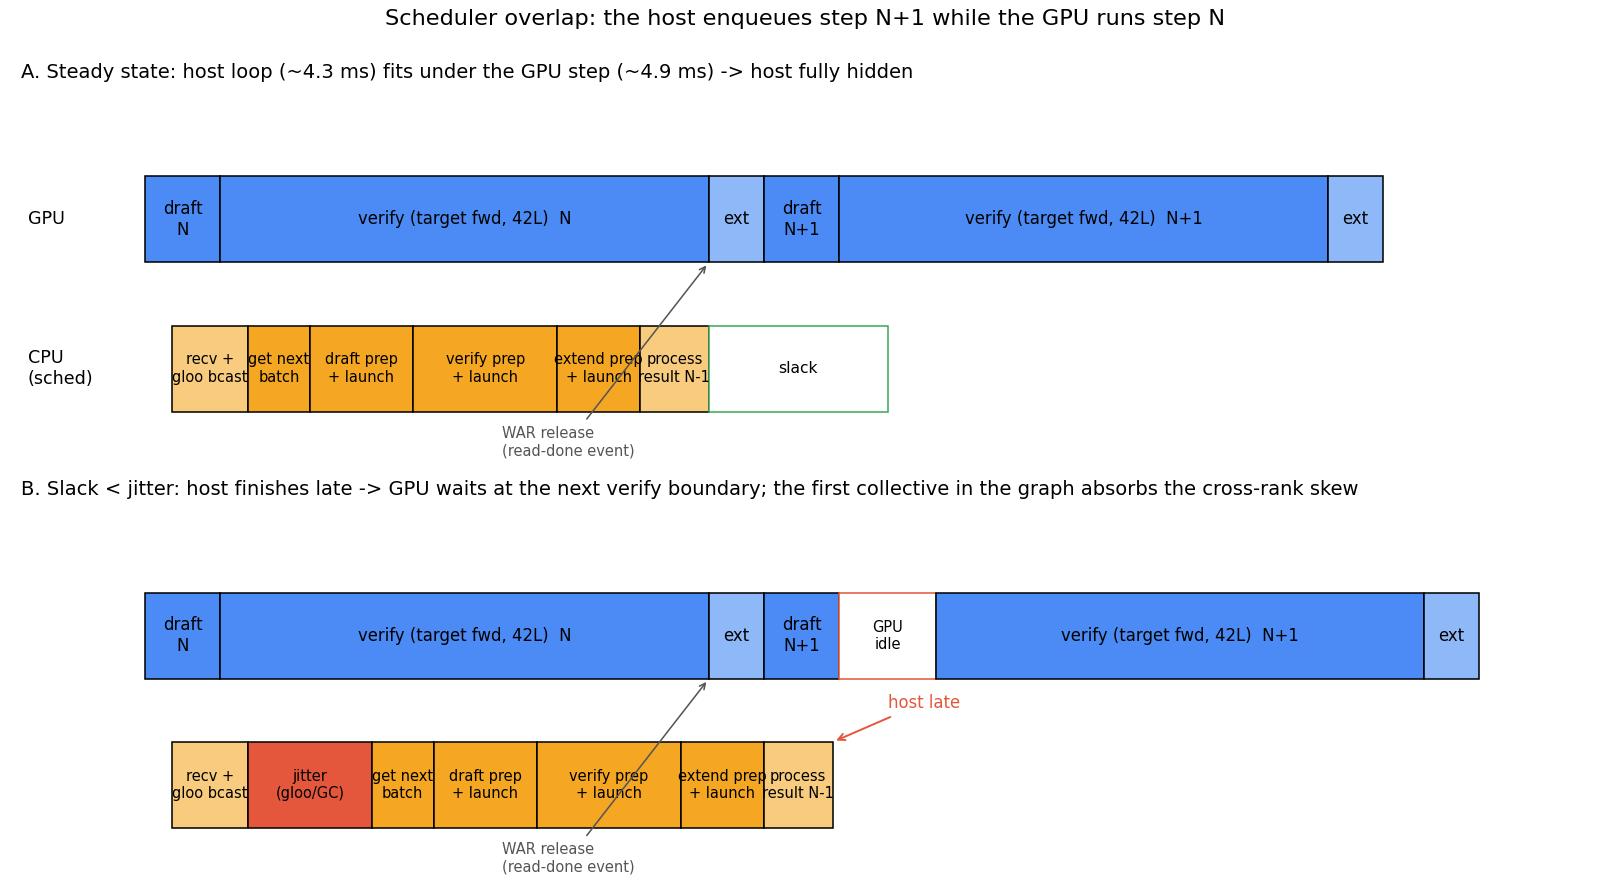
Figure 6. Where the slack lives. Panel A: the host loop (~4.3 ms) fits under the GPU step (~4.9 ms), so it is fully hidden. Panel B: when jitter (a gloo broadcast or a GC pause) exceeds the slack, the host finishes late and the GPU waits at the next verify boundary, where the first collective in the graph absorbs the cross-rank skew.
Run-ahead also changes the shape of host cost. Instead of every rank paying its host time directly every step, only a rank that exhausts its queue slack pays. In one four-rank trace, exactly one rank was in that state: its scheduler segment ran 5-10x longer than its siblings, its draft graph launched 40-80 µs late, its draft→verify seam ran +165 µs above the others' median, and it showed periodic 400-750 µs spikes with a GC signature. The other three ranks spin-waited for it at every rendezvous. The diagnostic that generalizes: a kernel's duration is not its work. A 20 KB embedding all-reduce showing 150-480 µs is not a slow all-reduce; it is absorbing skew, and only cross-rank time alignment tells you which rank is late.
With the lockstep pin gone, the seams between graphs became worth shrinking. Before a CUDA graph replays, step-specific attention metadata (kv indices, block tables, mamba state slots) has to be rebuilt from the live req_to_token and seq_lens into the graph's captured static buffers. That refill runs eagerly every step and is most of what a seam contains. At batch 1 it is purely host-bound: each op costs 5-15 µs to dispatch and 1-4 µs to execute.
We attacked it at two levels. First, fuse the index chains: assign_extend_cache_locs_uniform computes end offsets inside the kernel (the uniform draft_token_num expansion makes the cross-row prefix sum unnecessary), and _fused_state_indices_kernel collapses a gather, a translate, a padding-sentinel write, and a copy_ into one launch, carefully preserving both side effects, including zeroing req_pool_indices on padded rows, which nothing in that function needs but other captured kernels in the graph depend on for in-bounds gathers.
Second, capture the refill itself into a small CUDA graph keyed by (bs, forward_mode) . This works because of a pointer-stability property the replay contract already guarantees: the replay ForwardBatch view hands the backend only runner-static buffers and pool-resident tensors, so the whole prep sequence has fixed addresses. Four safety mechanisms surround it: two eager warmups, so Triton JIT and autotune happen outside capture; a snapshot of each backend's forward_metadata object restored before every replay (the graph replays device ops, the snapshot restores Python pointers); permanent eager fallback with a warning if capture fails; and guards against padding, TBO, pdmux, and LoRA. It ships opt-in behind SGLANG_ENABLE_METADATA_GLUE_GRAPH and is force-disabled for DFLASH-family speculation, because that path rebuilds its attention plan on the host every step and capturing the refill would freeze the plan at capture time.
There is a hard boundary on what may be captured. The criterion: a refill made of pure device kernels writing persistent buffers is capturable; anything that goes through a FlashInfer-style plan() is not. The draft side fails it: the multi-step draft backend re- plan() s wrappers that the main EAGLE graph has already captured, and recording that re-plan into a secondary graph corrupts the wrappers' internal state on replay. A related requirement is that capture be idempotent. trtllm_mla 's _init_cuda_graph_metadata used to allocate fresh tensors and replace its decode_cuda_graph_metadata[bs] entry on every call, which leaves earlier graphs reading freed memory after a second capture.
A batch-1 step executes several hundred kernel nodes in a short window. At that size, launch and prologue cost about as much as the math. Programmatic Dependent Launch (PDL) lets a consumer kernel be scheduled onto SMs while its producer is still running: the consumer executes everything that does not depend on the producer's output and fences at gdc_wait() only before the dependent read.
Figure 7. PDL on the router path. Without PDL, each kernel starts only after the previous one fully retires, and the gate matvec's cold-HBM weight load sits on the critical path. With PDL, the weight tile load is producer-independent, so it is issued before gdc_wait() and a 2.6 MB cold read flies under the producer's tail; the router top-k prefetches its bias the same way.
We wired three chains: the MoE main chain ( moe_align → up-GEMM → activation → down-GEMM → combine → all-reduce), the router chain (norm → gate matvec → top-k), and the KDA chain ( conv1d_update → recurrent delta-rule → gated norm). Two design points matter.
Producer-independent loads go before the wait. That is the whole trick in the figure, and it is what makes PDL more than launch-overhead removal for latency-bound kernels.
Inductor kernels cannot carry PDL attributes. The small-M MoE combine was a torch.compile -generated kernel; joining the chain meant swapping it for the repo's Triton reduction plus GDC. That had a numerical side effect: fp32 sum × scale with a single final cast, where the old path rounded twice. The result is slightly more accurate but not bit-equal, which the commit message declares.
Later we upgraded the semantics after a finding in PTX griddepcontrol : launch_dependents only releases the launch of dependents, while a consumer's wait always fences on the producer grid's complete retirement. Moving the trigger from the end of the producer to immediately after the producer's own wait lets a consumer's prologue overlap more of the producer's body than just its tail, subject to one precondition: the consumer must still keep its own gdc_wait() between the early launch and every read of producer output. That is a property of each consumer, not a blanket guarantee, so we checked it kernel by kernel and converted six. What the early trigger buys is also not deterministic: the driver may launch a dependent grid early, and how much overlap materializes depends on scheduling and resource pressure at the time (CUDA programming guide:https://docs.nvidia.com/cuda/cuda-programming-guide/04-special-topics/programmatic-dependent-launch.html). fused_moe gates this behind an M ≤ 512 check: at prefill shapes, releasing a large consumer grid early steals SMs from the producer, while at decode shapes it is pure gain.
PDL is pure scheduling semantics. Changes whose accumulation order is unchanged stay bitwise identical; the gate matvec passed a 4-of-4 GDC-on/off bit comparison.
moe_align , on the pair axis. The Triton fused-MoE GEMM consumes tokens in block_size tiles where every row shares an expert, and moe_align_block_size builds that permutation. The generic path needs two kernel launches: no token can be placed until every expert's offset is final, those offsets come out of a grid-wide scan, and a device-wide barrier exists only at a kernel boundary. A single-launch variant exists, but it stages per-thread expert counters in shared memory, so it is limited to 64 experts or fewer; a 513-expert decode always paid two launches.
The replacement works on the pair axis: an [NP, NP] pairwise comparison gives every (token, slot) pair a stable rank within its bucket and its bucket population in one shot; the rank-0 representative of each bucket then derives padded counts, bucket-ordered exclusive offsets, the published total, and per-block expert ids. Nothing scales with the expert count, so the expert-count limit disappears. The obvious alternative, histogram and cumsum over the padded expert axis (up to 1024 buckets), is correct but puts about 3x more single-SM work on the critical path than the two kernels it replaces. That is what makes the pair axis load-bearing here.
Two deliberate deviations from the reference, both argued from consumer invariants: intra-bucket order is stable in pair index rather than atomic-scheduling order (every pair writes its own output row, so consumers are order-invariant), and the buffer tail beyond the published total is left unwritten (consumer CTAs early-exit before reading it). One cliff: the pairwise tensors are O(NP²). They live entirely in registers at NP=64 (about 4 µs, on par with the CUDA two-kernel path) and spill to local memory at NP=256, costing about 230 µs per launch. The dispatch gate is a hard numel ≤ 64 ; larger batches fall back to the CUDA path.
SwiGLU in the up-GEMM epilogue. Folding silu(gate) * up into the MoE up-GEMM epilogue removes a standalone activation kernel per MoE layer and the whole write-then-read of the intermediate buffer. The layout trick is a per-expert row interleave of w13 applied at weight load, which makes gate and up land in adjacent even/odd columns of the same output tile. Since each GEMM output column is an independent dot product, interleaving is bitwise neutral.
Bit parity is where the care went. The kernel being replaced is compiled with -use_fast_math , so the epilogue reproduces it instruction by instruction: mul + ex2.approx.ftz for __expf , div.approx.ftz , and a single final rounding on the product. The subtle part: FlashInfer instantiates the activation functor in float , so silu never lands in bf16 before the multiply. Round it there and the result double-rounds and diverges on a large fraction of inputs. That is invisible in the documentation and invisible to a tolerance check; it takes an element-wise bit comparison over the full input range.
KDA chain-verify tile economics. The fused conv1d + gating delta-rule verify kernel already existed; these commits retuned it. On the rotating-cold test with in-graph timing, the Blackwell curve at T=6 is monotone: BV=4 at 11.56 µs, 8 at 12.53, 16 at 12.83, 32 at 14.26, 64 at 20.7, 128 at 38. BV=4 wins by up to 19% per call because 256 CTAs is 1.7 waves over 148 SMs, and duplicating the q/k convolution 32 times is still cheaper than shortening the serial chain. Tiling the V dimension never touches the K-dimension reduction order, so at num_warps=4 every BV is bitwise identical to the baseline and the retune carries no numerical risk.
The largest single post-structural change was a dtype change. At batch 1, the router gate and the lm_head are pure bandwidth: every decode step cold-reads each MoE layer's gate weight (2.6 MB in bf16) and the vocab-parallel lm_head projection, and neither has arithmetic to hide the read behind. Running both in bf16 instead of fp32 halves those bytes; end to end it was worth roughly +10%, the largest gain of any single change after the host run-ahead fix. Like the other rounding changes above, this one was declared in its commit message and validated on accept length and task metrics rather than bit parity.
A rejected speculative token leaves a KV cache entry harmlessly stale, but it has already corrupted a recurrent state in place. Linear attention and speculation do not coexist for free.
The scheme that makes it work: during verify, the recurrence runs with state updates disabled and writes each chain position's post-state into an intermediate buffer; after the verdict, commit_mamba_states_after_verify copies the state belonging to the last accepted position into the persistent slot. Stage, then commit. This is also why the compact spec cache is restricted to topk=1 : with a chain, the accepted prefix is unique and states can be indexed by position; with a tree, the accepted path is one of many and states would have to be indexed by tree path.
Profiling shows KDA decode is bandwidth-bound, mostly HBM traffic on the K×V state, so beyond the fusion and the tile retune there is not much left there. We did not measure achieved bandwidth against the Blackwell peak, so read that as a shape observation rather than a roofline result.
Weight-bandwidth dominance has a counter-intuitive corollary: verifying more tokens is nearly free. Verifying 4 tokens and verifying 6 tokens read exactly the same weights. Deepening speculation at batch 1 costs one extra cheap draft forward per added step (the draft is a single layer) plus the incremental serial cost in the KDA chain-verify recurrence, and buys accept length.
We swept it rather than assuming it (this sweep predates the fusion bundle; the optimum moved afterwards, as noted below):
The step-time column is TPOT × accept length, a derived estimate rather than a direct measurement. Each added step costs about 4-9% of step time while the marginal accept gain decays geometrically (d5 → d6 adds only 0.08). The break-even condition is roughly Δaccept > 0.05 × accept . The optimum also moves: after the fusion bundle landed and step time dropped, (5, 6) became the better configuration; once fp8 weights shrink the fixed base further, it will need another sweep.
Tuning NEXTN's depth is a one-dimensional knob on a fixed-shape algorithm. The larger lever is changing the algorithm, and the second half of the campaign went into bringing DSpark onto the same target and giving it the same batch-1 treatment.
The DSpark algorithm itself is public. The work here is adapting that public recipe to Ling-3.0-flash, long-context online distillation, and the batch-1 Blackwell serving stack. Our adaptation differs in four ways.
Distribution-aligned data. We distill mainly on Ling-3.0-flash post-training data, so the draft trains on the distribution it will face at serving time. We also use multiple sampling settings during distillation to improve trajectory diversity and robustness under speculative decoding.
An ablation-driven draft design. Instead of directly inheriting the Ling-3.0-flash architecture, we ran systematic ablations over key draft choices, including whether to reuse the Ling-3 attention structure and which RoPE variant to use (partial or interleaved). We kept the design with the best acceptance-length/latency tradeoff.
A serving-coupled online training system. For long-context and large-scale online training we built SplitServe Trainer, a single-node 8-GPU framework that splits resources evenly between training and SGLang inference. During training, the inference side runs target forwards to produce supervision signals such as target hidden states for the draft. This keeps the generation-training loop local, cuts IO overhead, and improves training efficiency for long-context workloads.

 Scan to open this article